Background: Dahomey gained its independence from France in 1960; the name was changed to Benin in 1975. From 1974 to 1989 the country was a socialist state; free elections were reestablished in 1991.
Government type: republic under multiparty democratic rule; dropped Marxism-Leninism December 1989; democratic reforms adopted February 1990; transition to multiparty system completed 4 April 1991.
Capital: Porto-Novo is the official capital; Cotonou is the seat of government
Currency: 1 Communaute Financiere Africaine franc (CFAF) = 100 centimes
Geography of Benin
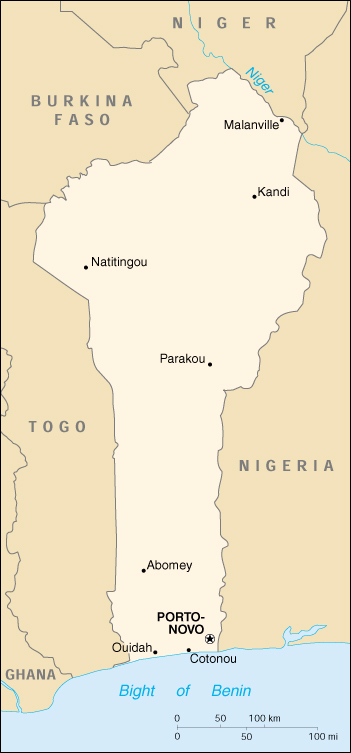
Location: Western Africa, bordering the North Atlantic Ocean, between Nigeria and Togo
Geographic coordinates: 9 30 N, 2 15 E
Area:
total: 112,620 sq. km
land: 110,620 sq. km
water: 2,000 sq. km
Land boundaries:
total: 1,989 km
border countries: Burkina Faso 306 km, Niger 266 km, Nigeria 773 km, Togo 644 km
Coastline: 121 km
Maritime claims:
territorial sea: 200 nm
Climate: tropical; hot, humid in south; semiarid in north
Terrain: mostly flat to undulating plain; some hills and low mountains
Elevation extremes:
lowest point: Atlantic Ocean 0 m
highest point: Mont Sokbaro 658 m
Natural resources: small offshore oil deposits, limestone, marble, timber
Land use:
arable land: 13%
permanent crops: 4%
permanent pastures: 4%
forests and woodland: 31%
other: 48% (1993 est.)
Irrigated land: 100 sq. km (1993 est.)
Natural hazards: hot, dry, dusty harmattan wind may affect north in winter
Environment – current issues: inadequate supplies of potable water; poaching threatens wildlife populations; deforestation; desertification
Environment – international agreements:
party to: Biodiversity, Climate Change, Desertification, Endangered Species, Environmental Modification, Hazardous Wastes, Law of the Sea, Nuclear Test Ban, Ozone Layer Protection, Ship Pollution, Wetlands
signed, but not ratified: none of the selected agreements
Geography – note: sandbanks create difficult access to a coast with no natural harbors, river mouths, or islands.
People of Benin
The majority of Benin’s 6.59 million people live in the south. The population is young, with a life expectancy of 50 years. About 42 African ethnic groups live in this country; these various groups settled in Benin at different times and also migrated within the country. Ethnic groups include the Yoruba in the southeast (migrated from Nigeria in the 12th century); the Dendi in the north-central area (they came from Mali in the 16th century); the Bariba and the Fulbe (Peul) in the northeast; the Betammaribe and the Somba in the Atacora Range; the Fon in the area around Abomey in the South Central and the Mina, Xueda, and Aja (who came from Togo) on the coast.
French is the official language but is spoken more in urban than in rural areas. The literacy rate is 52.2% adult males and 23.6% adult females, and slowly growing. Recent migrations have brought other African Nationals to Benin: Nigerians, Togolese, Malians, etc. The foreign community also includes many Lebanese and Indians involved in trade and commerce. The personnel of the many European Embassies and Foreign Aid Missions and of nongovernmental organizations and various missionary groups account for a large number of the 5,500 European population.
Several religions are practiced in Benin. Animism is widespread (50%), and its practices vary from one ethnic group to the other. Arab merchants introduced Islam in the north and among the Yoruba. European missionaries brought Christianity to the south and central areas of Benin. Moslems account for 20% of the population and Christians for 30%. Many nominal Moslems and Christians continue to practice animistic traditions. It is believed that voodoo originated in Benin and was introduced to Brazil and the Caribbean Islands by slaves taken from this particular area of the Slave Coast.
Population: 7,460,025 (July 2005 est.)
note: estimates for this country explicitly take into account the effects of excess mortality due to AIDS; this can result in lower life expectancy, higher infant mortality and death rates, lower population and growth rates, and changes in the distribution of population by age and sex than would otherwise be expected
Age structure:
0-14 years: 47.32%
15-64 years: 50.38%
65 years and over: 2.3%
Population growth rate: 2.97%
Birth rate: 44.23 births/1,000 population
Death rate: 14.51 deaths/1,000 population
Net migration rate: 0 migrant(s)/1,000 population
Infant mortality rate: 89.68 deaths/1,000 live births
Life expectancy at birth:
total population: 49.94 years
male: 49.02 years
female: 50.88 years
Total fertility rate: 6.23 children born/woman
Nationality:
noun: Beninese (singular and plural)
adjective: Beninese
Ethnic groups: African 99% (42 ethnic groups, most important being Fon, Adja, Yoruba, Bariba), Europeans 5,500
Religions: indigenous beliefs 50%, Christian 30%, Muslim 20%
Languages: French (official), Fon and Yoruba (most common vernaculars in south), tribal languages (at least six major ones in north)
Literacy:
definition: age 15 and over can read and write
total population: 37.5%
male: 52.2%
female: 23.6%
Benin Economy
Economy – overview: The economy of Benin remains underdeveloped and dependent on subsistence agriculture, cotton production, and regional trade. Growth in real output averaged a sound 5% in 1996-99, but a rapid population rise offset much of this growth. Inflation has subsided over the past several years. Commercial and transport activities, which make up a large part of GDP, are vulnerable to developments in Nigeria, particularly fuel shortages. The Paris Club and bilateral creditors have eased the external debt situation in recent years. While high fuel prices constrained growth in 2000, increased cotton production – enabled by a major restructuring program – and an expansion of the Cotonou port, may lead to increased growth in 2001.
GDP: purchasing power parity – $6.6 billion (2000 est.)
GDP – real growth rate: 5% (2000 est.)
GDP – per capita: purchasing power parity – $1,030 (2000 est.)
GDP – composition by sector:
agriculture: 37.9%
industry: 13.5%
services: 48.6% (1999)
Population below poverty line: 37.2% (1999 est.)
Inflation rate (consumer prices): 3% (2000 est.)
Budget:
revenues: $299 million
expenditures: $445 million, including capital expenditures of $14 million (1995 est.)
Industries: textiles, cigarettes; beverages, food; construction materials, petroleum
Industrial production growth rate: 6.9% (2000 est.)
Electricity – production: 226 million kWh (1999)
Electricity – production by source:
fossil fuel: 24.78%
hydro: 75.22%
nuclear: 0%
other: 0% (1999)
Electricity – consumption: 510.2 million kWh (1999)
Electricity – exports: 0 kWh (1999)
Electricity – imports: 300 million kWh (1999)
Agriculture – products: corn, sorghum, cassava (tapioca), yams, beans, rice, cotton, palm oil, peanuts; poultry, livestock
Exports: $396 million (f.o.b., 1999)
Exports – commodities: cotton, crude oil, palm products, cocoa
Exports – partners: Brazil 14%, Libya 5%, Indonesia 4%, Italy 4% (1999)
Imports: $566 million (f.o.b., 1999)
Imports – commodities: foodstuffs, tobacco, petroleum products, capital goods
Imports – partners: France 38%, China 16%, United Kingdom 9%, Cote d’Ivoire 5% (1999)
Debt – external: $1.6 billion (1998 est.)
Economic aid – recipient: $274.6 million (1997)
Currency: 1 Communaute Financiere Africaine franc (CFAF) = 100 centimes
Map of Benin