Background: After centuries of Swedish and Russian rule, Estonia attained independence in 1918. Forcibly incorporated into the USSR in 1940, it regained its freedom in 1991 with the collapse of the Soviet Union. Since the last Russian troops left in 1994, Estonia has been free to promote economic and political ties with Western Europe.
Government type: parliamentary democracy
Capital: Tallinn
Currency: 1 Estonian kroon (EEK) = 100 sents
Geography of Estonia
Location: Eastern Europe, bordering the Baltic Sea and Gulf of Finland, between Latvia and Russia
Geographic coordinates: 59 00 N, 26 00 E
Area:
total: 45,226 sq. km
land: 43,211 sq. km
water: 2,015 sq. km
note: includes 1,520 islands in the Baltic Sea
Land boundaries:
total: 633 km
border countries: Latvia 339 km, Russia 294 km
Coastline: 3,794 km
Maritime claims:
exclusive economic zone: limits fixed in coordination with neighboring states
territorial sea: 12 nm
Climate: maritime, wet, moderate winters, cool summers
Terrain: marshy, lowlands
Elevation extremes:
lowest point: Baltic Sea 0 m
highest point: Suur Munamagi 318 m
Natural resources: shale oil (kukersite), peat, phosphorite, amber, cambrian blue clay, limestone, dolomite, arable land
Land use:
arable land: 25%
permanent crops: 0%
permanent pastures: 11%
forests and woodland: 44%
other: 20% (1996 est.)
Irrigated land: 110 sq. km (1996 est.)
Natural hazards: flooding occurs frequently in the spring
Environment – current issues: air heavily polluted with sulfur dioxide from oil-shale burning power plants in northeast; contamination of soil and groundwater with petroleum products, chemicals at former Soviet military bases; Estonia has more than 1,400 natural and manmade lakes, the smaller of which in agricultural areas are heavily affected by organic waste; coastal sea water is polluted in many locations.
Environment – international agreements:
party to: Air Pollution, Air Pollution-Nitrogen Oxides, Air Pollution-Sulphur 85, Air Pollution-Volatile Organic Compounds, Biodiversity, Climate Change, Endangered Species, Hazardous Wastes, Ship Pollution, Ozone Layer Protection, Wetlands
signed, but not ratified: Climate Change-Kyoto Protocol
Geography – note: the mainland terrain is flat, boggy, and partly wooded; offshore lie more than 1,500 islands.
People of Estonia
The name “Eesti,” or Estonia, is derived from the word “Aisti,” the name given by the ancient Germans to the peoples living northeast of the Vistula River. The Roman historian Tacitus in the first century A.D. was the first to mention the Aisti, and early Scandinavians called the land south of the Gulf of Finland “Eistland,” and the people “aistr.” Estonians belong to the Baltic-Finnic group of the Finno-Ugric peoples, as do the Finns and Hungarians. Archaeological research supports the existence of human activity in the region as early as 8,000 BC but by 3,500 BC the principal ancestors of the Estonians had arrived from the east.
Estonians look like and consider themselves Nordics, evidenced through the strong cultural and religious influences gained over centuries during Germanic and Scandinavian colonization and settlement. This highly literate society places strong emphasis upon education, which is free and compulsory until age 16. The first book in Estonian was printed in 1525. Most Estonians belong to the Evangelical Lutheran Church, but a sizable minority are Russian Orthodox.
From 1945-1989 the percentage of ethnic Estonians in Estonia dropped from 94% to 61%, caused primarily by the Soviet program promoting mass immigration of urban industrial workers from Russia, Ukraine, and Belarus, as well as by wartime emigration and Stalin’s mass deportations and executions. Estonia’s citizenship law and constitution meet international and OSCE standards, guaranteeing universal human and civil rights.
Written with the Latin alphabet, Estonian is the language of the Estonian people and the official language of the country. One-third of the standard vocabulary is derived from adding suffixes to root words. The oldest known examples of written Estonian originate in 13th century chronicles. The Soviet era had imposed the official use of Russian, so most Estonians speak Russian as a second language while the resident Slavic populace speaks Russian as a first language.
Population: 1,332,893 (July 2005 est.)
Age structure:
0-14 years: 17.08%
15-64 years: 68.14%
65 years and over: 14.78%
Population growth rate: -0.55%
Birth rate: 8.7 births/1,000 population
Death rate: 13.48 deaths/1,000 population
Net migration rate: -0.76 migrant(s)/1,000 population
Infant mortality rate: 12.62 deaths/1,000 live births
Life expectancy at birth:
total population: 69.73 years
male: 63.72 years
female: 76.05 years
Total fertility rate: 1.21 children born/woman
Nationality:
noun: Estonian(s)
adjective: Estonian
Ethnic groups: Estonian 65.1%, Russian 28.1%, Ukrainian 2.5%, Byelorussian 1.5%, Finn 1%, other 1.8% (1998)
Religions: Evangelical Lutheran, Russian Orthodox, Estonian Orthodox, Baptist, Methodist, Seventh-Day Adventist, Roman Catholic, Pentecostal, Word of Life, Jewish
Languages: Estonian (official), Russian, Ukrainian, English, Finnish, other
Literacy:
definition: age 15 and over can read and write
total population: 100% (1998 est.)
History of Estonia
Estonia’s struggles for independence during the twentieth century were in large part a reaction to nearly 700 years of foreign rule. Before 1200 the Estonians lived largely as free peasants loosely organized into parishes (kihelkonnad ), which in turn were grouped into counties (maakonnad ). In the early 1200s, the Estonians and the Latvians came under assault of crusaders from Germany seeking to impose Christianity on them. Although the Estonians’ resistance to the Teutonic Knights lasted some twenty years, the lack of a centralized political organization as well as inferior weaponry eventually brought down the Estonians in 1227. The Germans, moving from the south, were abetted by Danish forces that invaded from the north and captured Tallinn. Together with present-day Latvia, the region became known as Livonia; the Germans and Danes settled down as nobility, and the Estonians were progressively subordinated as serfs. During 1343-45 an Estonian peasant uprising against the German and Danish nobility prompted the Danes to relinquish their control of northern Estonia to the Germans. After this resistance was crushed, the area remained generally peaceful for two centuries.
Commerce developed rapidly because Estonia’s larger urban centers at the time–Tallinn, Tartu, Pärnu, and Narva–were all members of the Hanseatic League, an organization established by merchants of various, mostly German, cities to protect their mutual trading interests. Still, foreign rivalries over the strategic Livonian region began to reemerge in the mid-sixteenth century as the fighting capacity of the Germans diminished and that of neighboring Muscovy began to increase. The ensuing twenty-five-year struggle for control of Livonia was precipitated by an invasion by Ivan IV (the Terrible) (r. 1533-84) in 1558. The advancing Russians wiped out the disintegrating forces of the Teutonic Knights and nearly succeeded in conquering the whole area. However, Swedish and Polish intervention reversed the Russian gains and forced Ivan eastward, back behind Lake Peipsi. Peace between Sweden and Poland in Livonia was also slow in coming, with Sweden eventually winning most of the territory by 1629. By this time, decades of war had caused huge population losses (in some areas, over 50 percent), affecting urban and rural areas alike.
Under Swedish rule, northern Estonia was incorporated into the Duchy of Estland. The southern part, together with northern Latvia, became known as Livland. This division of Estonian lands would last until 1917. The German-based nobility in both areas retained and even strengthened its position under Swedish suzerainty. Meanwhile, the Estonian peasants saw their lot worsen as more and more of their land and output were appropriated by seigniorial estates. Still, during the Swedish era, Estonian education got its start with the founding of Tartu University in 1632 and the establishment of the first Estonian parish schools in the 1680s. Although the population also began to grow during this period of peace, war and suffering once again were not far away. Swedish hegemony during the late seventeenth century had become overextended, making the Swedes’ holdings a prime target for a newly expansionist Russia.
In his first attempt to conquer Estland and Livland, during the Great Northern War (1700-09), Peter I (the Great) (r. 1682-1725) met with defeat at Narva at the hands of Sweden’s Charles XII (r. 1697-1718). A second campaign in 1708 saw Peter introduce a scorched-earth policy across many parts of the area. The outcome was victory for Russia in 1710 and acquisition of a “window to the West.” In taking control of Estland and Livland for what would be the next 200 years, tsarist Russia recognized the rights and privileges of the local German nobility, whose members amounted to only a small fraction of the population. Although the extent of the nobles’ autonomy in the two areas was always contested, especially under Catherine II (the Great) (r. 1762-96), the Baltic Germans did develop a strong loyalty to the Russian tsars as guarantors of their landed privileges. German control over the Estonian peasantry reached its high point during the eighteenth century. Labor overtook taxes-in-kind as the predominant means of controlling the serfs. The first real reforms of serfdom, which gave peasants some rights, took place in 1804. In 1816 and 1819, the serfs were formally emancipated in Estland and Livland, respectively.
By the mid-nineteenth century, the Estonians were fast developing into an independent society and nation. The number of urbanized Estonians had grown considerably, overtaking what had been German majorities in the cities. Industrialization was also breaking down the old order. An Estonian cultural awakening began in the 1850s and 1860s (see Religion; Language and Culture, this ch.). Tsarist reaction and a fierce Russification campaign in the 1880s could not extinguish the new Estonian spirit, although for the most part Estonian demands continued to focus on culture. Political demands for Estonian autonomy found strong expression during the Revolution of 1905, and an All-Estonian Congress was organized in Tartu that same year. Although radical Estonian politicians such as Jaan Teemant and moderate leaders such as Jaan Tõnisson were deeply divided on tactics, there were widespread calls from the Estland and Livland provinces for a unification of Estonian lands and an official end to Russification. Repression of the 1905 movement was severe in Estland, although Tõnisson’s moderate Estonian Progressive People’s Party survived and went on to participate in Russia’s new assembly, the Duma. Amid the turmoil, Baltic Germans also grew apprehensive; they would be upset even more with the outbreak of World War I, which would pit Russia against their conationals.
The fall of the tsarist regime in February 1917 forced the issue of Estonia’s political future. Vigorous lobbying in Petrograd by Tõnisson and the large Estonian population living there forced the provisional government to accept Estonia’s territorial unification as one province and the election of a provincial assembly, the Maapäev, later that year. The election results showed significant support for leftist parties, including the Bolsheviks, Social Democrats, and Social Revolutionaries. Voting was complicated, however, by the presence of numerous military personnel from outside Estonia.
The Bolshevik takeover in Petrograd in November 1917 extended to Estonia as well, until Germany occupied Estonia in February 1918. Most of Estonia’s other political parties realized they were caught between the two forces and agreed to begin an active search for outside support. Representatives were sent to the major European capitals to secure Western recognition of an Estonian declaration of independence. As the Bolsheviks retreated from Tallinn and the German occupation army entered the city, the Committee of Elders (or standing body) of the Maapäev declared the country independent on February 24, 1918.
Early History
Estonia’s struggles for independence during the twentieth century were in large part a reaction to nearly 700 years of foreign rule. Before 1200 the Estonians lived largely as free peasants loosely organized into parishes (kihelkonnad ), which in turn were grouped into counties (maakonnad ). In the early 1200s, the Estonians and the Latvians came under assault from German crusaders seeking to impose Christianity on them. Although the Estonians’ resistance to the Teutonic Knights lasted some twenty years, the lack of a centralized political organization as well as inferior weaponry eventually brought down the Estonians in 1227. The Germans, moving from the south, were abetted by Danish forces that invaded from the north and captured Tallinn. Together with present-day Latvia, the region became known as Livonia; the Germans and Danes settled down as nobility, and the Estonians were progressively subordinated as serfs. During 1343-45 an Estonian peasant uprising against the German and Danish nobility prompted the Danes to relinquish their control of northern Estonia to the Germans. After this resistance was crushed, the area remained generally peaceful for two centuries.
Commerce developed rapidly because Estonia’s larger urban centers at the time–Tallinn, Tartu, Pärnu, and Narva–were all members of the Hanseatic League, an organization established by merchants of various, mostly German, cities to protect their mutual trading interests. Still, foreign rivalries over the strategic Livonian region began to reemerge in the mid-sixteenth century as the fighting capacity of the Germans diminished and that of neighboring Muscovy began to increase. The ensuing twenty-five-year struggle for control of Livonia was precipitated by an invasion by Ivan IV (the Terrible) (r. 1533-84) in 1558. The advancing Russians wiped out the disintegrating forces of the Teutonic Knights and nearly succeeded in conquering the whole area. However, Swedish and Polish intervention reversed the Russian gains and forced Ivan eastward, back behind Lake Peipsi. Peace between Sweden and Poland in Livonia was also slow in coming, with Sweden eventually winning most of the territory by 1629. By this time, decades of war had caused huge population losses (in some areas, over 50 percent), affecting urban and rural areas alike.
Under Swedish rule, northern Estonia was incorporated into the Duchy of Estland. The southern part, together with northern Latvia, became known as Livland. This division of Estonian lands would last until 1917. The German-based nobility in both areas retained and even strengthened its position under Swedish suzerainty. Meanwhile, the Estonian peasants saw their lot worsen as more and more of their land and output were appropriated by seigniorial estates. Still, during the Swedish era, Estonian education got its start with the founding of Tartu University in 1632 and the establishment of the first Estonian parish schools in the 1680s. Although the population also began to grow during this period of peace, war and suffering once again were not far away. Swedish hegemony during the late seventeenth century had become overextended, making the Swedes’ holdings a prime target for a newly expansionist Russia.
In his first attempt to conquer Estland and Livland, during the Great Northern War (1700-09), Peter I (the Great) (r. 1682-1725) met with defeat at Narva at the hands of Sweden’s Charles XII (r. 1697-1718). A second campaign in 1708 saw Peter introduce a scorched-earth policy across many parts of the area. The outcome was victory for Russia in 1710 and acquisition of a “window to the West.” In taking control of Estland and Livland for what would be the next 200 years, tsarist Russia recognized the rights and privileges of the local German nobility, whose members amounted to only a small fraction of the population. Although the extent of the nobles’ autonomy in the two areas was always contested, especially under Catherine II (the Great) (r. 1762-96), the Baltic Germans did develop a strong loyalty to the Russian tsars as guarantors of their landed privileges. German control over the Estonian peasantry reached its high point during the eighteenth century. Labor overtook taxes-in-kind as the predominant means of controlling the serfs. The first real reforms of serfdom, which gave peasants some rights, took place in 1804. In 1816 and 1819, the serfs were formally emancipated in Estland and Livland, respectively.
By the mid-nineteenth century, the Estonians were fast developing into an independent society and nation. The number of urbanized Estonians had grown considerably, overtaking what had been German majorities in the cities. Industrialization was also breaking down the old order. An Estonian cultural awakening began in the 1850s and 1860s. Tsarist reaction and a fierce Russification campaign in the 1880s could not extinguish the new Estonian spirit, although for the most part Estonian demands continued to focus on culture. Political demands for Estonian autonomy found strong expression during the Revolution of 1905, and an All-Estonian Congress was organized in Tartu that same year. Although radical Estonian politicians such as Jaan Teemant and moderate leaders such as Jaan Tõnisson were deeply divided on tactics, there were widespread calls from the Estland and Livland provinces for a unification of Estonian lands and an official end to Russification. Repression of the 1905 movement was severe in Estland, although Tõnisson’s moderate Estonian Progressive People’s Party survived and went on to participate in Russia’s new assembly, the Duma. Amid the turmoil, Baltic Germans also grew apprehensive; they would be upset even more with the outbreak of World War I, which would pit Russia against their conationals.
The fall of the tsarist regime in February 1917 forced the issue of Estonia’s political future. Vigorous lobbying in Petrograd by Tõnisson and the large Estonian population living there forced the provisional government to accept Estonia’s territorial unification as one province and the election of a provincial assembly, the Maapäev, later that year. The election results showed significant support for leftist parties, including the Bolsheviks, Social Democrats, and Social Revolutionaries. Voting was complicated, however, by the presence of numerous military personnel from outside Estonia.
The Bolshevik takeover in Petrograd in November 1917 extended to Estonia as well, until Germany occupied Estonia in February 1918. Most of Estonia’s other political parties realized they were caught between the two forces and agreed to begin an active search for outside support. Representatives were sent to the major European capitals to secure Western recognition of an Estonian declaration of independence. As the Bolsheviks retreated from Tallinn and the German occupation army entered the city, the Committee of Elders (or standing body) of the Maapäev declared the country independent on February 24, 1918.
Interwar Independence, 1918-40
In contrast to its later peaceful return to independence in 1991, Estonia’s first modern era of sovereignty began with a fifteen-month war (1918-20) against both Russian Bolshevik and Baltic German forces. In the end, the War of Independence took the lives of about 3,600 Estonians and left about 14,000 wounded. In the Tartu Peace Treaty, which was concluded with Russia in February 1920, Moscow relinquished all claims to Estonia in perpetuity. A year later, Estonia gained international recognition from the Western powers and became a member of the League of Nations. In June 1920, Estonia’s first constitution was promulgated, establishing a parliamentary system.
With a political system in place, the new Estonian government immediately began the job of rebuilding. As one of its first major acts, the government carried out an extensive land reform, giving tracts to small farmers and veterans of the War of Independence. The large estates of the Baltic German nobility were expropriated, breaking its centuries-old power as a class.
Agriculture dominated the country’s economy. Thanks to land reform, the number of small farms doubled to more than 125,000. Although many homesteads were small, the expansion of landownership helped stimulate new production after the war. Land reform, however, did not solve all of Estonia’s early problems. Estonian agriculture and industry (mostly textiles and machine manufacturing) had depended heavily on the Russian market. Independence and Soviet communism closed that outlet by 1924, and the economy had to reorient itself quickly toward the West, to which the country also owed significant war debts. The economy began to grow again by the late 1920s but suffered another setback during the Great Depression, which hit Estonia during 1931-34. By the late 1930s, however, the industrial sector was expanding anew, at an average annual rate of 14 percent. Industry employed some 38,000 workers by 1938.
Independent Estonia’s early political system was characterized by instability and frequent government turnovers. The political parties were fragmented and were about evenly divided between the left and right wings. The first Estonian constitution required parliamentary approval of all major acts taken by the prime minister and his government. The Riigikogu (State Assembly) could dismiss the government at any time, without incurring sanctions. Consequently, from 1918 to 1933 a total of twenty-three governments held office.
The country’s first big political challenge came in 1924 during an attempted communist takeover. In the depths of a nationwide economic crisis, leaders of the Estonian Communist Party (Eestimaa Kommunistlik Partei–EKP), in close contact with Communist International leaders from Moscow, believed the time was ripe for a workers’ revolution to mirror that of the Soviet Union. On the morning of December 1, some 300 party activists moved to take over key government outposts in Tallinn, while expecting workers in the capital to rise up behind them. The effort soon failed, however, and the government quickly regained control. In the aftermath, Estonian political unity got a strong boost, while the communists lost all credibility. Relations with the Soviet Union, which had helped to instigate the coup, deteriorated sharply.
By the early 1930s, Estonia’s political system, still governed by the imbalanced constitution, again began to show signs of instability. As in many other European countries at the time, pressure was mounting for a stronger system of government. Several constitutional changes were proposed, the most radical being put forth by the protofascist League of Independence War Veterans. In a 1933 referendum, the league spearheaded replacement of the parliamentary system with a presidential form of government and laid the groundwork for an April 1934 presidential election, which it expected to win. Alarmed by the prospect of a league victory and possible fascist rule, the caretaker prime minister, Konstantin Päts, organized a pre-emptive coup d’état on March 12, 1934. In concert with the army, Päts began a rule by decree that endured virtually without interruption until 1940. He suspended the parliament and all political parties, and he disbanded the League of Independence War Veterans, arresting several hundred of its leaders. The subsequent “Era of Silence” initially was supported by most of Estonian political society. After the threat from the league was neutralized, however, calls for a return to parliamentary democracy resurfaced. In 1936 Päts initiated a tentative liberalization with the election of a constituent assembly and the adoption of a new constitution. During elections for a new parliament, however, political parties remained suspended, except for Päts’s own National Front, and civil liberties were only slowly restored. Päts was elected president by the new parliament in 1938.
The Soviet Era, 1940-85
Although the period of authoritarian rule that lasted from 1934 to 1940 was a low point in Estonian democracy, in perspective its severity clearly would be tempered by the long Soviet era soon to follow. The clouds over Estonia and its independence began to gather in August 1939, when Nazi Germany and the Soviet Union signed the Nazi-Soviet Nonaggression Pact (also known as the Molotov-Ribbentrop Pact), dividing Eastern Europe into spheres of influence. Moving to capitalize on its side of the deal, the Soviet Union soon began to pressure Estonia, Latvia, and Lithuania into signing the Pact of Defense and Mutual Assistance, which would allow Moscow to station 25,000 troops in Estonia. President Päts, in weakening health and with little outside support, acceded to every Soviet demand. In June 1940, Soviet forces completely occupied the country, alleging that Estonia had “violated” the terms of the mutual assistance treaty. With rapid political maneuvering, the regime of Soviet leader Joseph V. Stalin then forced the installation of a pro-Soviet government and called for new parliamentary elections in July. The Estonian Communist Party, which had only recently reemerged from underground with fewer than 150 members, organized the sole list of candidates permitted to run. Päts and other Estonian political leaders meanwhile were quietly deported to the Soviet Union or killed. With the country occupied and under total control, the communists’ “official” electoral victory on June 17-18 with 92.8 percent of the vote was merely window dressing. On July 21, the new parliament declared Estonia a Soviet republic and “requested” admission into the Soviet Union. In Moscow, the Supreme Soviet granted the request on August 6, 1940.
For all the ups and downs Estonia’s independent government experienced during the interwar period, its termination by Stalin in 1940 was clearly not among the range of solutions favored by most Estonians. Yet, chances of holding off the Soviet onslaught with an army numbering about 15,000 men were slim at best. Thus, Estonia’s only real hope for the future lay in continued Western recognition of its de jure statehood, which other European countries and the United States declared in 1940. Over the next fifty years, this Western policy of token recognition nearly fell into desuetude. Yet, the policy’s survival into the late 1980s would allow it to become a rallying point for Estonia’s new drive for independence. Thanks to this continuing Western recognition, Estonia’s calls for sovereignty from Moscow by early 1990 could not be considered merely secessionism. Rather, they represented demands for the restoration of a state still existent under international law. This appeal to international legality dating to 1940 would frustrate the attempts of Soviet leader Mikhail S. Gorbachev to control Estonia and the other Baltic states in the late 1980s.
Estonia’s absorption into the Soviet Union as the Estonian Soviet Socialist Republic was interrupted in June 1941 by the German invasion. Still, that one year of Soviet rule left a deep mark on the Estonians. In addition to the takeover of their country and the rapid nationalization of their capitalist economy, on June 13-14, 1941, before the German invasion, Estonians also saw the mass deportation of some 10,000 of their countrymen to Siberia. Of those seized during the one-night operation, over 80 percent were women, children, or elderly people. The purpose of this action seemed to be to create terror rather than to neutralize any actual threat to the regime. The 1941-44 German occupation witnessed more repression, especially of Estonia’s Jewish population, which numbered about 2,000. In September 1944, as the Red Army again neared Estonia, the memories of Soviet rule resurfaced vividly enough to prompt some 70,000 Estonians to flee the country into exile. These émigrés later formed ethnic communities in Sweden, the United States, Canada, Britain, Australia, and elsewhere, continuing to lobby for Estonia’s rights during the next fifty years. Altogether, from 1939 to 1945 Estonia lost over 20 percent of its population to the turmoil of Soviet and German expansionism.
After the war, the Sovietization of Estonia resumed. The republic’s war-ravaged industry was rebuilt as a component of the centrally planned economy. Agricultural collectivization was enforced, climaxing in March 1949 with another, more brutal wave of deportations involving some 25,000 people. The Estonian Communist Party was purged in 1950 of many of its original native leaders; they were replaced by several prominent Russified Estonians who had grown up in Russia. After Stalin’s death in 1953, Nikita S. Khrushchev’s liberalization also touched Estonia. Efforts at economic reform were undertaken, and repression was eased. By the late 1960s, consumerism had taken root, and intellectual life was relatively vibrant. Following the Soviet Union’s suppression of Czechoslovakia’s “Prague Spring” reform movement in 1968, the trend toward openness suffered a reversal, but Estonia continued to maintain a standard of living well above the Soviet average. In 1980, during the period of stagnation under Soviet leader Leonid I. Brezhnev, some 2,000 schoolchildren demonstrated in the streets of Tallinn against a major Russification campaign launched from Moscow. Several dozen Estonian intellectuals later came together to write their own protest letter, but to no avail. Karl Vaino, the Russified Estonian leader of the Estonian Communist Party at the time, was particularly hostile toward dissent of any kind.
The Pursuit of Independence, 1985-91
The dawning of glasnost and perestroika in the Soviet Union initiated a period of liberalization from which the dying superpower would never recover. Estonia seized on this opportunity in 1987, beginning with public protests against a phosphorus-mining project proposed by the central government that would have seriously damaged the country’s environment. Pressure for economic reform became acute later in the year when a group of four Estonian liberals put forth a plan for economic autonomy for the republic. In 1988 Estonia’s “singing revolution” took off, energized by the removal of Karl Vaino as Estonian Communist Party chief in June and his replacement by a native son, Vaino Väljas. In April the Estonian Popular Front was founded as the capstone to a summer of political activity unparalleled since 1940. This mobilization proved effective in November when Estonia opposed attempts by Gorbachev to strengthen central authority through changes in the Soviet Union’s constitution. In an act of defiance, the Estonian parliament, then known as the Supreme Soviet, declared the republic’s right to sovereignty on November 16. It also called for a new union treaty to be drawn up to govern the Soviet state.
By the spring of 1989, Estonia had thrown down the gauntlets of political sovereignty and economic autonomy. A two-year effort to force their acceptance by Moscow followed. On the political front, Estonia’s strongest strategy was to invoke history. At the Soviet Union’s first Congress of People’s Deputies in Moscow, in 1989, Estonian and other Baltic deputies battled with Gorbachev to have the Soviet Union reveal the true story of the Nazi-Soviet Nonaggression Pact in time for the fiftieth anniversary of the pact in August. Just days before the anniversary, a commission charged with studying the pact concluded that secret protocols dividing up Poland and the Baltic states had indeed existed. Armed with this finding, Estonia literally linked up with its Baltic neighbors on August 23 to form a 600-kilometer human chain from Tallinn to the Lithuanian capital, Vilnius, to draw worldwide attention to the anniversary of the pact and to their cause. An estimated 2 million Baltic residents participated in the show of unity, but the action also elicited a harsh rebuke from Moscow several days later. Tensions quickly mounted in Estonia, and the Estonian Popular Front decided to cancel a major song festival and rally planned for early September. In early August, Estonian nationalists had already been shaken by their first confrontation with Soviet loyalists. Members of the International Movement of Workers in the Estonian Soviet Socialist Republic (Intermovement), primarily made up of ethnic Russians, had staged strikes in Tallinn and northeastern Estonia protesting a set of new electoral rules and a new language law requiring all service workers to speak both Estonian and Russian. Many Russians in Estonia, fearful of growing Estonian national feeling and of losing their privileges, looked to Moscow for help. But direct intervention would not come.
Throughout the fall, independence sentiment continued to mount. In October the Estonian Popular Front issued a campaign platform for upcoming municipal elections in which it publicly endorsed full independence. Meanwhile, more radical groups had begun organizing their own campaign to restore independence, completely bypassing the Soviet system. These groups, known as Estonian Citizens Committees, maintained that because their country had been illegally occupied and annexed by the Soviet Union and because the prewar republic still retained international recognition, it could not legitimate Soviet authority by negotiating “secession.” Rather, Estonia had to insist on the continuing legal authority of the prewar republic as the only sure way to ward off Soviet attempts to keep it in the union. By invoking international law, Estonia could also enlist Western support and protection at a time when the Soviet Union needed good relations with the West to facilitate its own reforms. By the fall of 1989, it was clear that this argument and strategy would become essential to the independence movement and, indeed, to politics thereafter.
To raise popular awareness of the independence issue, the Estonian Citizens Committees mounted a year-long campaign to register all citizens of the prewar republic and their descendants. Of an estimated 1 million such citizens, the grassroots movement succeeded in registering about 700,000. It was this electorate that, according to the radical committees, possessed the sole right to decide the future of Soviet-occupied Estonia–not the Soviet-era Supreme Soviet, its government, or even the half-million Soviet-era immigrants to Estonia and their descendants, whom the committees claimed had taken up residence under the terms of the Soviet occupation and who would later be denied automatic citizenship. Rather, the committees asserted the need to elect a new representative body to lead the independence struggle and the restoration of the prewar republic. In February 1990, they organized nationwide elections for a Congress of Estonia, which held its first session the following month.
Although their campaign enabled the citizens committees and the Congress to gain a fair amount of popular support, most Estonians were not totally willing to forsake the Supreme Soviet because it, too, was up for election in March 1990. The more moderate Estonian Popular Front favored the Supreme Soviet as a more realistic path to independence. The Estonian Popular Front campaigned heavily in March and won about forty of the 101 seats. The Supreme Soviet elections also allowed all residents of Estonia to vote, including Soviet-era immigrants and their descendants. These were mostly Russians who, still led primarily by Estonian Communist Party functionaries, finally elected a total of twenty-seven pro-Soviet deputies. Although the two-thirds Estonian majority consequently was slim, it was enough for the Supreme Soviet to declare at its first full session, on March 30, the country’s official intention to reestablish its independence.
Unlike Lithuania’s declaration of independence, Estonia’s declaration was not an outright break with the Soviet Union. Rather, it was an attempt to find a compromise between the radical Congress of Estonia and moderate Estonian Popular Front positions. Still, the message of asserting independence from Moscow was the same. The Kremlin’s reaction was subdued; no economic sanctions were imposed on Estonia. Neither, however, was any recognition accorded Estonia’s dec-laration, nor were any serious attempts made to begin talks with the new government in Tallinn. In the meantime, therefore, Estonia attempted to shore up its stance by finding new allies and initiating independent economic policies. In May 1990, the leaders of Estonia, Latvia, and Lithuania met formally in Tallinn to coordinate their strategy. In July representatives of the three countries met for the first time with Boris N. Yeltsin, who had just been elected chairman of the Russian Supreme Soviet. Estonian politicians and government officials traveled in Western Europe and the United States to renew Western contacts.
Domestically, in the fall of 1990 the Estonian government, led by Estonian Popular Front leader Edgar Savisaar, began a series of moves to assert the republic’s economic independence and begin market reforms. Financial contributions to the all-union budget were stopped, and wide-ranging price reform was initiated. Plans for a separate currency, begun in 1989, continued to be worked on. In October the government dispatched militia forces to patrol the republic’s border with Russia and to control the movement of goods; control over western gateways remained under Soviet control.
Moscow’s bloody military assault on civilians in Vilnius and Riga in January 1991 sent shock waves through Estonia as well. Although there were no violent incidents in Estonia, Soviet loyalists staged a noisy demonstration in Tallinn, and the government installed huge boulders in front of the parliament building for protection. On January 12, Tallinn was the site of a hastily organized summit meeting between the Baltic leaders and Yeltsin, who supported the sovereignty of the three republics against Gorbachev. Yeltsin and Estonian parliament chairman Arnold Rüütel signed a bilateral treaty recognizing the sovereignty of each other’s republic. When, later in the month, Gorbachev announced a nationwide referendum on the issue of preserving the Soviet Union, Estonia decided to preempt the ballot with a referendum of its own on independence. The March 3 Estonian poll showed 78 percent in favor of independence and indicated significant support for independence among Russian residents–as much as 30 percent. Most Estonians boycotted the Soviet referendum held two weeks later. With public opinion clearly favoring independence, Gorbachev agreed to official talks with Estonia beginning on March 28. The talks continued through August and the Moscow coup, but no progress was made. Estonia refused to join negotiations for a new union treaty, while the Kremlin avoided any specifics on independence. The talks were further upset by several hit-and-run attacks on Estonia’s border outposts during the summer of 1991. These were generally attributed to units of the Soviet Ministry of Internal Affairs Special Forces Detachment (Otryad militsii osobogo naznacheniya–OMON), commonly known as the Black Berets, over which Gorbachev apparently had lost control.
Independence Reclaimed, August 1991-October 1992
On the night of August 19, 1991, Estonia was caught up in the uncertainty generated by the attempted coup in Moscow. A column of Soviet light tanks and troop carriers had already started to move on Tallinn as the commander of Soviet forces in the Baltics announced his support of the coup. Fearing a total crackdown by the Soviet army, the Estonian parliament met in emergency session on August 20. At 11:00 P.M., the Supreme Council, as the legislature was now known, passed a final resolution declaring full independence and requesting de facto international recognition. Volunteers were mustered to defend key government buildings and communications centers; there was no bloodshed, however. As Heinz Valk, an artist and a member of parliament, later declared, “The coup in Moscow [gave] us a chance comparable to that in 1918.”
Once the coup finally collapsed, Estonia resumed its efforts to gain international recognition and otherwise reestablish itself as an independent state. Iceland was the first to acknowledge Estonian independence, on August 22; Yeltsin’s Russia was quick to follow, on August 24. The United States hesitated until September 2. The Soviet Union recognized Estonia on September 6. The process of state building also began soon after the coup. In contrast to Latvia and Lithuania, Estonia, in its August 20 independence declaration, took the additional step of convening a constitutional assembly immediately to draft a new basic law for the country. The assembly drew thirty members each from the Supreme Council and the Congress of Estonia, thus defusing rivalries between the two organizations. In mid-October the assembly settled on a working draft focused on a generally parliamentary form of government. Deliberations then slowed as the country got caught up in debates over citizenship.
In Estonia’s fight to regain independence, the overall strategy of asserting the country’s legal continuity as a state clearly had paid off. Yet, in terms of offering a path for the future, this strategy had many complications. One of these was the question of what to do with the 500,000 mostly Russian, Soviet-era immigrants living in Estonia. In 1990 the Congress of Estonia had been the first representative body to lay down the principle that because these people had settled in Estonia under Soviet rule, they were not automatically citizens of the legally restored Estonian state. Rather, under independence they would have to be “naturalized” on the basis of specific language and residency criteria. This position was also argued as a means of better integrating the mostly Russian noncitizen population, the majority of whom did not speak Estonian. In mid-1991, as the independence struggle seemed to languish, the Estonian government, led by Prime Minister Edgar Savisaar, showed signs of readiness to compromise on the citizenship issue in order to gain more local Russian support. However, after the failed August coup and the immediate onset of full independence, the Congress and other radical groups were emboldened to insist on the principle of restricted citizenship. Thus, the Supreme Council decided on November 11, 1991, to require the naturalization of all Soviet-era immigrants to Estonia while automatically renewing the citizenship of all prewar citizens and their descendants. In February 1992, the parliament set naturalization terms, which included a two-year residency requirement, the ability to speak conversational Estonian, and a one-year waiting period after applying.
Although these terms were relatively mild, the implications in Estonia’s particular situation remained less than clear. Most Soviet-era immigrants had already fulfilled the residency requirement, but at best only 20 percent were prepared to meet the language requirement. Most Russians living in Estonia had not bothered to learn the rudiments of the national language, forcing Estonians to speak Russian to them instead. It would take time for many to begin learning. In any case, the naturalization procedures would delay nationalization for at least the one-year waiting period. This outcome had serious implications because the resident Russians would then be ineligible to vote in the September 1992 elections for a new parliament. As the only consolation to noncitizens, the Constitu-tional Assembly later accorded them the right to vote in local elections under the terms of the new constitution.
The citizenship issue generally heightened tensions between Estonians and Russians. The more nationalistic Estonian deputies in parliament began to accuse the moderate government of Savisaar of foot-dragging. In January 1992, in the midst of a severe economic crisis and problems securing heating oil, Savisaar asked parliament for emergency powers. When the vote on emergency powers was taken on January 16, Savisaar won, thanks only to the votes of several Russian deputies. This narrow margin revealed the extent of Savisaar’s unpopularity among the Estonian deputies, and a week later he resigned. Savisaar’s transportation minister, Tiit Vähi, was charged with forming a new government, which was billed as one of technocrats and caretakers in advance of parliamentary elections in the fall.
As Vähi formed his regime, several major issues remained outstanding. The new prime minister’s first task was to oversee the passage of the naturalization requirements for citizenship, which occurred in late February. Then, the language and residency requirements were put into effect. Thereafter, the draft constitution drawn up by the Constitutional Assembly neared completion and required approval by popular referendum. This referendum was set for June 28, 1992, with only citizens allowed to participate. Alongside the proposed constitution, a second question asked the people whether to allow the earliest applicants for citizenship to vote on an exceptional basis in the upcoming nationwide elections. Because these applicants numbered just over 5,000, the gesture would be largely symbolic. However, a strong campaign by nationalist Estonian parties led to the defeat of the measure, 53 percent to 46 percent. The constitution was passed by a 91 percent majority.
On June 20, one week before the referendum, the Vähi government completed its third remaining task: currency reform. On that day, Estonian residents proudly cashed in their old, worn Russian rubles for crisp, new Estonian kroons (for value of the kroon–see Glossary). The kroon, pegged to the stable deutsche mark, would soon bring inflation tumbling down and serve as the basis for a new economy.
With the constitution approved and a new state structure in place, the campaign began for Estonia’s first post-Soviet elections. The election of a new legislature, the Riigikogu, on September 20 would mark the full restoration of the legal Republic of Estonia. On October 5, 1992, in its first session, the Riigikogu, which replaced the transitional Supreme Council, issued a declaration establishing its legal continuity with the prewar republic and declaring an official end to the transition to independence announced two-and-one-half years earlier.
Estonia Economy
Economy – overview: In 2000, Estonia rebounded from the Russian financial crisis by scaling back its budget and reorienting trade away from Russian markets into EU member states. After GDP shrank 1.1% in 1999, the economy made a strong recovery in 2000, with growth estimated at 6.4% – the highest in Central and Eastern Europe. Estonia joined the World Trade Organization in November 1999 – the second Baltic state to join – and continues its EU accession talks. For 2001, Estonians predict GDP to grow around 6%, inflation of between 4.2%-5.3%, and a balanced budget. Substantial gains were made in completing privatization of Estonia’s few remaining large, state-owned companies in 2000, and this momentum is expected to continue in 2001. Estonia hopes to join the EU during the next round of enlargement tentatively set for 2004.
GDP: purchasing power parity – $14.7 billion (2000 est.)
GDP – real growth rate: -0.5% (1999 est.), 6.4% (2000 est.)
GDP – per capita: purchasing power parity – $10,000 (2000 est.)
GDP – composition by sector:
agriculture: 3.6%
industry: 30.7%
services: 65.7% (1999)
Household income or consumption by percentage share:
lowest 10%: 3.2%
highest 10%: 28.5% (1996)
Inflation rate (consumer prices): 3.7% (1999 est.)
Labor force: 785,500 (1999 est.)
Labor force – by occupation: industry 20%, agriculture and forestry 11%, services 69% (1999 est.)
Unemployment rate: 11.7% (1999 est.)
Budget:
revenues: $1.37 billion
expenditures: $1.37 billion (1997 est.)
Industries: oil shale, shipbuilding, phosphates, electric motors, excavators, cement, furniture, clothing, textiles, paper, shoes, apparel
Industrial production growth rate: 3% (1996 est.), 5% (2000 est.)
Electricity – production: 7.782 billion kWh (1999)
Electricity – production by source:
fossil fuel: 99.72%
hydro: 0.09%
nuclear: 0%
other: 0.19% (1999)
Agriculture – products: potatoes, fruits, vegetables; livestock and dairy products; fish
Exports: $2.5 billion (f.o.b., 1999), $3.1 billion (f.o.b., 2000)
Exports – commodities: machinery and appliances 19%, wood products 15%, textiles 13%, food products 12%, metals 10%, chemical products 8% (1999)
Exports – partners: Sweden 19.3%, Finland 18.8%, Russia 8.8%, Latvia 8.8%, Germany 7.3%, United States 2.5% (1999)
Imports: $3.4 billion (f.o.b., 1999), $4 billion (f.o.b., 2000)
Imports – commodities: machinery and appliances 26%, foodstuffs 15%, chemical products 10%, metal products 9%, textiles 8% (1999)
Imports – partners: Finland 23%, Russia 13.2%, Sweden 10%, Germany 9.1%, United States 4.7 (1999)
Debt – external: $1.6 billion (2000 est.)
Economic aid – recipient: $137.3 million (1995)
Currency: Estonian kroon (EEK)
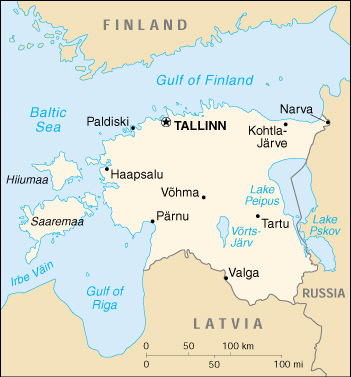
Map of Estonia