Background: Almost five centuries as a Portuguese colony came to a close with independence in 1975. Large-scale emigration by whites, economic dependence on South Africa, a severe drought, and a prolonged civil war hindered the country’s development. The ruling party formally abandoned Marxism in 1989, and a new constitution the following year provided for multiparty elections and a free market economy. A UN-negotiated peace agreement with rebel forces ended the fighting in 1992.
Government type: republic
Capital: Maputo
Currency: 1 metical (Mt) = 100 centavos
Geography of Mozambique
Location: Southern Africa, bordering the Mozambique Channel, between South Africa and Tanzania
Geographic coordinates: 18 15 S, 35 00 E
Area:
total: 801,590 sq km
land: 784,090 sq km
water: 17,500 sq km
Land boundaries:
total: 4,571 km
border countries: Malawi 1,569 km, South Africa 491 km, Swaziland 105 km, Tanzania 756 km, Zambia 419 km, Zimbabwe 1,231 km
Coastline: 2,470 km
Maritime claims:
exclusive economic zone: 200 nm
territorial sea: 12 nm
Climate: tropical to subtropical
Terrain: mostly coastal lowlands, uplands in center, high plateaus in northwest, mountains in west
Elevation extremes:
lowest point: Indian Ocean 0 m
highest point: Monte Binga 2,436 m
Natural resources: coal, titanium, natural gas, hydropower
Land use:
arable land: 4%
permanent crops: 0%
permanent pastures: 56%
forests and woodland: 18%
other: 22% (1993 est.)
Irrigated land: 1,180 sq km (1993 est.)
Natural hazards: severe droughts and floods occur in central and southern provinces; devastating cyclones
Environment – current issues: a long civil war and recurrent drought in the hinterlands have resulted in increased migration of the population to urban and coastal areas with adverse environmental consequences; desertification; pollution of surface and coastal waters.
Environment – international agreements:
party to: Biodiversity, Climate Change, Desertification, Endangered Species, Hazardous Wastes, Law of the Sea, Ozone Layer Protection
signed, but not ratified: none of the selected agreements
Geography – note: the mighty Zambezi flows through the north-central and most fertile part of the country.
People of Mozambique
Mozambique’s major ethnic groups encompass numerous subgroups with diverse languages, dialects, cultures, and histories.
The north-central provinces of Zambezia and Nampula are the most populous, with about 45% of the population. The estimated 4 million Makua are the dominant group in the northern part of the country; the Sena and Ndau are prominent in the Zambezi valley, and the Tsonga and Shangaan dominate in southern Mozambique.
Despite the influence of Islamic coastal traders and European colonizers, the people of Mozambique have largely retained an indigenous culture based on subsistence agriculture. Mozambique’s most highly developed art forms have been wood sculpture, for which the Makonde in northern Mozambique are particularly renowned, and dance. The middle and upper classes continue to be heavily influenced by the Portuguese colonial and linguistic heritage.
During the colonial era, Christian missionaries were active in Mozambique, and many foreign clergy remain in the country. While precise statistics are difficult to obtain, most observers believe that about 20%-30% of the population is Christian, 15%-20% Muslim, with the rest adhering to traditional beliefs.
Under the colonial regime, educational opportunities for black Mozambicans were limited, and 93% of the population was illiterate. After independence, the government placed a high priority on expanding education, which reduced the illiteracy rate to about two-thirds as primary school enrollment increased.
Population: 19,406,703 (July 2005 est.)
Age structure:
0-14 years: 42.72%
15-64 years: 54.53%
65 years and over: 2.75%
Population growth rate: 1.3%
Birth rate: 37.2 births/1,000 population
Death rate: 24.21deaths/1,000 population
Net migration rate: 0 migrant(s)/1,000 population
Infant mortality rate: 139.2 deaths/1,000 live births
Life expectancy at birth:
total population: 36.45 years
male: 37.25 years
female: 35.62 years
Total fertility rate: 4.82 children born/woman
Nationality:
noun: Mozambican(s)
adjective: Mozambican
Ethnic groups: indigenous tribal groups 99.66% (Shangaan, Chokwe, Manyika, Sena, Makua, and others), Europeans 0.06%, Euro-Africans 0.2%, Indians 0.08%
Religions: indigenous beliefs 50%, Christian 30%, Muslim 20%
Languages: Portuguese (official), indigenous dialects
Literacy:
definition: age 15 and over can read and write
total population: 42.3%
male: 58.4%
female: 27% (1998 est.)
History of Mozambique
Mozambique’s first inhabitants were San hunter and gatherers, ancestors of the Khoisani peoples. Between the first and fourth centuries AD, waves of Bantu-speaking peoples migrated from the north through the Zambezi River valley and then gradually into the plateau and coastal areas. The Bantu were farmers and ironworkers.
When Portuguese explorers reached Mozambique in 1498, Arab trading settlements had existed along the coast for several centuries. From about 1500, Portuguese trading posts and forts became regular ports of call on the new route to the east. Later, traders and prospectors penetrated the interior regions seeking gold and slaves. Although Portuguese influence gradually expanded, its power was limited and exercised through individual settlers who were granted extensive autonomy. As a result, development lagged while Lisbon devoted itself to the more lucrative trade with India and the Far East and to the colonization of Brazil.
By the early 20th century the Portuguese had shifted the administration of much of the country to large private companies, controlled and financed mostly by the British, which established railroad lines to neighboring countries and supplied cheap, often forced, African labor to the mines and plantations of the nearby British colonies. Because policies were designed to benefit white settlers and the Portuguese homeland, little attention was paid until the last years of colonial rule to the development of Mozambique’s economic infrastructure or the skills of its population.
After World War II, while many European nations were granting independence to their colonies, Portugal clung to the concept that Mozambique and other Portuguese possessions were overseas provinces of the mother country, and emigration to the colonies soared. Mozambique’s Portuguese population at the time of independence was about 250,000. The drive for Mozambican independence developed apace, and in 1962 several anti-colonial political groups formed the Front for the Liberation of Mozambique (FRELIMO), which initiated an armed campaign against Portuguese colonial rule in September 1964. After 10 years of sporadic warfare and major political changes in Portugal, Mozambique became independent on June 25, 1975. FRELIMO quickly established a one-party Marxist state and outlawed rival political activity.
Mozambique Economy
Economy – overview: Before the peace accord of October 1992, Mozambique’s economy was devastated by a protracted civil war and socialist mismanagement. In 1994, it ranked as one of the poorest countries in the world. Since then, Mozambique has undertaken a series of economic reforms. Almost all aspects of the economy have been liberalized to some extent. More than 900 state enterprises have been privatized. A value-added tax, introduced in 1999, launched the government’s comprehensive tax reform program. Pending are much needed commercial code reform and greater private sector involvement in the transportation, telecommunications, and energy sectors. Since 1996, inflation has been low and foreign exchange rates relatively stable. Albeit from a small base, Mozambique’s economy grew at an annual 10% rate in 1997-99, one of the highest growth rates in the world. Growth slowed and inflation rose in 2000 due to devastating flooding in the early part of the year. Both indicators should recover in 2001. The country depends on foreign assistance to balance the budget and to pay for a trade imbalance in which imports greatly outnumber exports. The trade situation should improve in the medium term, however, as trade and transportation links to South Africa and the rest of the region have been improved and sizeable foreign investments are beginning to materialize. Among these investments are metal production (aluminum, steel), natural gas, power generation, agriculture, fishing, timber, and transportation services. Mozambique has received a formal cancellation of a large portion of its external debt through an IMF initiative and is scheduled to receive additional relief.
GDP: purchasing power parity – $19.1 billion (2000 est.)
GDP – real growth rate: 3.8% (2000 est.)
GDP – per capita: purchasing power parity – $1,000 (2000 est.)
GDP – composition by sector:
agriculture: 44%
industry: 19%
services: 37% (1999 est.)
Household income or consumption by percentage share:
lowest 10%: 2.5%
highest 10%: 31.7% (1996-97)
Inflation rate (consumer prices): 11.4% (2000 est.)
Labor force: 7.4 million (1997 est.)
Labor force – by occupation: agriculture 81%, industry 6%, services 13% (1997 est.)
Unemployment rate: 21% (1997 est.)
Budget:
revenues: $466.9 million
expenditures: $1.004 billion, including capital expenditures of $502.5 million (2000 est.)
Industries: food, beverages, chemicals (fertilizer, soap, paints), petroleum products, textiles, cement, glass, asbestos, tobacco
Industrial production growth rate: 39% (1997), 7.2% (1999)
Electricity – production: 1.2 billion kWh (1998), 2.3 billion kWh (1999)
Electricity – production by source:
fossil fuel: 13.04%
hydro: 86.96%
nuclear: 0%
other: 0% (1999)
Electricity – consumption: 307 million kWh (1999)
Agriculture – products: cotton, cashew nuts, sugarcane, tea, cassava (tapioca), corn, rice, tropical fruits; beef, poultry
Exports: $300 million (f.o.b., 1999 est.), $390 million (f.o.b., 2000 est.)
Exports – commodities: prawns 40%, cashews, cotton, sugar, citrus, timber; bulk electricity (2000)
Exports – partners: EU 27%, South Africa 26%, Zimbabwe 15%, India 12%, US 5%, Japan 4% (1999 est.)
Imports: $1.6 billion (c.i.f., 1999 est.), $1.4 billion (c.i.f., 2000 est.)
Imports – commodities: machinery and equipment, mineral products, chemicals, metals, foodstuffs, textiles (2000)
Imports – partners: South Africa 44%, EU 16%, US 6.5%, Japan 6.5%, Pakistan 3%, India 3% (1999 est.)
Debt – external: $4.8 billion (1999), $1.4 billion (2000 est.)
Economic aid – recipient: $1.04 billion (1998)
Currency: metical (MZM)
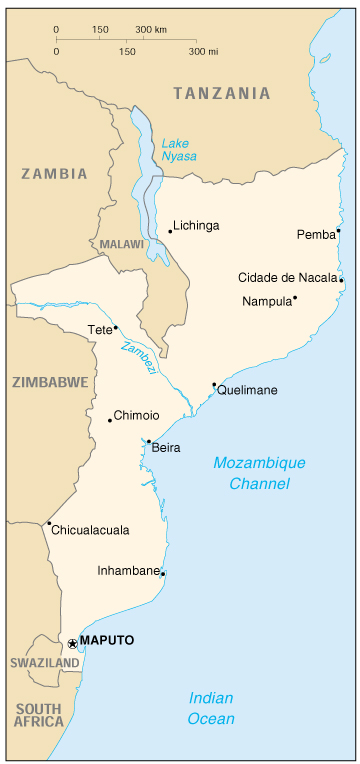
Map of Mozambique