Background: An Orthodox Christian country, Armenia was incorporated into Russia in 1828 and the USSR in 1920. Armenian leaders remain preoccupied by the long conflict with Azerbaijan over Nagorno-Karabakh, a primarily Armenian-populated exclave, assigned to Soviet Azerbaijan in the 1920s by Moscow. Armenia and Azerbaijan began fighting over the exclave in 1988; the struggle escalated after both countries attained independence from the Soviet Union in 1991. By May 1994, when a cease-fire took hold, Armenian forces held not only Nagorno-Karabakh but also a significant portion of Azerbaijan proper. The economies of both sides have been hurt by their inability to make substantial progress toward a peaceful resolution.
Government type: republic
Capital: Yerevan
Currency: 1 dram = 100 luma
Geography of Armenia
Location: Southwestern Asia, east of Turkey
Geographic coordinates: 40 00 N, 45 00 E
Map references: Commonwealth of Independent States
Area:
total: 29,800 sq. km
land: 28,400 sq. km
water: 1,400 sq. km
Land boundaries:
total: 1,254 km
border countries: Azerbaijan-proper 566 km, Azerbaijan-Naxcivan exclave 221 km, Georgia 164 km, Iran 35 km, Turkey 268 km
Coastline: 0 km (landlocked)
Climate: highland continental, hot summers, cold winters
Terrain: Armenian Highland with mountains; little forest land; fast flowing rivers; good soil in Aras River valley
Elevation extremes:
lowest point: Debed River 400 m
highest point: Aragats Lerr 4,095 m
Natural resources: small deposits of gold, copper, molybdenum, zinc, alumina
Land use:
arable land: 17%
permanent crops: 3%
permanent pastures: 24%
forests and woodland: 15%
other: 41% (1993 est.)
Irrigated land: 2,870 sq km (1993 est.)
Natural hazards: occasionally severe earthquakes; droughts
Environment – current issues: soil pollution from toxic chemicals such as DDT; energy blockade, the result of conflict with Azerbaijan, has led to deforestation when citizens scavenged for firewood; pollution of Hrazdan (Razdan) and Aras Rivers; the draining of Sevana Lich (Lake Sevan), a result of its use as a source for hydropower, threatens drinking water supplies; restart of Metsamor nuclear power plant without adequate (IAEA-recommended) safety and backup systems
Environment – international agreements:
party to: Air Pollution, Biodiversity, Climate Change, Desertification, Hazardous Wastes, Nuclear Test Ban, Ozone Layer Protection, Wetlands
signed, but not ratified: Air Pollution-Persistent Organic Pollutants
Geography – note: Armenia is landlocked.
Physical Environment
Armenia is located in southern Transcaucasia, the region southwest of Russia between the Black Sea and the Caspian Sea. Modern Armenia occupies part of historical Armenia, whose ancient centers were in the valley of the Aras River and the region around Lake Van in Turkey. Armenia is bordered on the north by Georgia, on the east by Azerbaijan, on the southwest by the Nakhichevan Autonomous Republic of Azerbaijan, on the south by Iran, and on the west by Turkey.
Topography and Drainage
Twenty-five million years ago, a geological upheaval pushed up the earth’s crust to form the Armenian Plateau, creating the complex topography of modern Armenia. The Lesser Caucasus range extends through northern Armenia, runs southeast between Lake Sevan and Azerbaijan, then passes roughly along the Armenian-Azerbaijani border to Iran. Thus situated, the mountains make travel from north to south difficult. Geological turmoil continues in the form of devastating earthquakes, which have plagued Armenia. In December 1988, the second largest city in the republic, Leninakan (now Gyumri), was heavily damaged by a massive quake that killed more than 25,000 people.
About half of Armenia’s area of approximately 29,800 square kilometers has an elevation of at least 2,000 meters, and only 3 percent of the country lies below 650 meters. The lowest points are in the valleys of the Aras River and the Debet River in the far north, which have elevations of 380 and 430 meters, respectively. Elevations in the Lesser Caucasus vary between 2,640 and 3,280 meters. To the southwest of the range is the Armenian Plateau, which slopes southwestward toward the Aras River on the Turkish border. The plateau is masked by intermediate mountain ranges and extinct volcanoes. The largest of these, Mount Aragats, 4,430 meters high, is also the highest point in Armenia. Most of the population lives in the western and northwestern parts of the country, where the two major cities, Erevan and Gyumri (which was called Aleksandropol’ during the tsarist period), are located.
The valleys of the Debet and Akstafa rivers form the chief routes into Armenia from the north as they pass through the mountains. Lake Sevan, 72.5 kilometers across at its widest point and 376 kilometers long, is by far the largest lake. It lies 2,070 meters above sea level on the plateau. Terrain is most rugged in the extreme southeast, which is drained by the Bargushat River, and most moderate in the Aras River valley to the extreme southwest. Most of Armenia is drained by the Aras or its tributary, the Razdan, which flows from Lake Sevan. The Aras forms most of Armenia’s border with Turkey and Iran as well as the border between Azerbaijan’s adjacent Nakhichevan Autonomous Republic and Iran.
Climate
Temperatures in Armenia generally depend upon elevation. Mountain formations block the moderating climatic influences of the Mediterranean Sea and the Black Sea, creating wide seasonal variations. On the Armenian Plateau, the mean midwinter temperature is 0° C, and the mean midsummer temperature exceeds 25° C. Average precipitation ranges from 250 millimeters per year in the lower Aras River valley to 800 millimeters at the highest altitudes. Despite the harshness of winter in most parts, the fertility of the plateau’s volcanic soil made Armenia one of the world’s earliest sites of agricultural activity.
Environmental Problems
A broad public discussion of environmental problems began in the mid-1980s, when the first “green” groups formed in opposition to Erevan’s intense industrial air pollution and to nuclear power generation in the wake of the 1986 reactor explosion at Chernobyl’. Environmental issues helped form the basis of the nationalist independence movement when environmental demonstrations subsequently merged with those for other political causes in the late 1980s.
In the post-communist era, Armenia faces the same massive environmental cleanup that confronts the other former Soviet republics as they emerge from the centralized planning system’s disastrous approach to resource management. By 1980 the infrequency of sightings of Mount Ararat, which looms about sixty kilometers across the Turkish border, became a symbol of worsening air pollution in Erevan.
In independent Armenia, environmental issues divide society (and scientists) sharply into those who fear “environmental time bombs” and those who view resumption of pollution-prone industrial operations as the only means of improving the country’s economy. In the early 1990s, the latter group blamed Armenia’s economic woes on the role played by the former in closing major industries.
In 1994 three national environmental laws were in effect: the Law on Environmental Protection, the Basic Law on the Environment, and the Law on Mineral Resources. The Council of Ministers, Armenia’s cabinet, includes a minister of the environment. However, no comprehensive environmental protection program has emerged, and decisions on environmental policy have been made on an ad hoc basis.
Environmental conditions in Armenia have been worsened by the Azerbaijani blockade of supplies and electricity from outside. Under blockade conditions, the winters of 1991-92, 1992-93, and 1993-94 brought enormous hardship to a population lacking heat and electric power. (The large-scale felling of trees for fuel during the winters of the blockade has created another environmental crisis.) The results of the blockade and the failure of diplomatic efforts to lift it led the government to propose reconstruction of the Armenian Atomic Power Station at Metsamor, which was closed after the 1988 earthquake because of its location in an earthquake-prone area and which had the same safety problems as reactors listed as dangerous in Bulgaria, Russia, and Slovakia. After heated debates over startup continued through 1993, French and Russian nuclear consultants declared operating conditions basically safe. Continuation of the blockade into 1994 gave added urgency to the decision.
Another environmental concern is a significant drop in Lake Sevan’s water level because of drawdowns for irrigation and the diversion of water to hydroelectric plants to compensate for the electric power lost through the inactivity of the nuclear plant at Metsamor. This crisis was addressed in 1992-93 by construction of a tunnel to divert water into the lake from the Arpa River. Engineers estimated that once the project is finished, the tunnel will allow 500 million cubic meters of water to be drawn from the lake annually, while maintaining a constant water level. The Ministry of the Environment reported that the lake’s water level had dropped by fifty centimeters in 1993. Experts said that this drop brought the level to within twenty-seven centimeters of the critical point where flora and fauna would be endangered.
Among major industrial centers closed to curtail pollution were the Nairit Chemical Plant, the Alaverdy Metallurgical Plant, and the Vanadzor Chemical Combine. Economic requirements triumphed over environmental considerations when the Soviet-era Nairit plant was reopened in January 1992 after being closed in 1989 because of the massive air pollution it caused. Newly independent Armenia needed the income from foreign sales of Nairit rubber and chemical products, many of which had been assigned exclusively to that plant under the Soviet system and were still unavailable elsewhere to the former Soviet republics in the early 1990s. Up-to-date environmental safety technology and adherence to international standards were promised at Nairit when the decision to resume production was announced.
People of Armenia
Population: 2,982,904 (July 2005 est.)
Age structure:
0-14 years: 23.23% (male 394,194; female 380,911)
15-64 years: 67.04% (male 1,094,646; female 1,141,760)
65 years and over: 9.73% (male 135,477; female 189,112) \
Population growth rate: -0.21%
Birth rate: 11.47 births/1,000 population
Death rate: 9.74 deaths/1,000 population
Net migration rate: -3.87 migrant(s)/1,000 population
Infant mortality rate: 41.27 deaths/1,000 live births
Life expectancy at birth:
total population: 66.49 years
male: 62.12 years
female: 71.08 years
Total fertility rate: 1.5 children born/woman
Nationality:
noun: Armenian(s)
adjective: Armenian
Ethnic groups: Armenian 93%, Azeri 3%, Russian 2%, other (mostly Yezidi Kurds) 2% (1989)
note: as of the end of 1993, virtually all Azeris had emigrated from Armenia
Religions: Armenian Orthodox 94%
Languages: Armenian 96%, Russian 2%, other 2%
Literacy:
definition: age 15 and over can read and write
total population: 99%
male: 99%
female: 98% (1989 est.)
History of Armenia
ARMENIAN CIVILIZATION HAD its beginnings in the sixth century B.C. In the centuries following, the Armenians withstood invasions and nomadic migrations, creating a unique culture that blended Iranian social and political structures with Hellenic– and later Christian–literary traditions. For two millennia, independent Armenian states existed sporadically in the region between the northeastern corner of the Mediterranean Sea and the Caucasus Mountains, until the last medieval state was destroyed in the fourteenth century. A landlocked country in modern times, Armenia was the smallest Soviet republic from 1920 until the dissolution of the Soviet Union in 1991. The future of an independent Armenia is clouded by limited natural resources and the prospect that the military struggle to unite the Armenians of Azerbaijan’s Nagorno-Karabakh Autonomous Region with the Republic of Armenia will be a long one.
The Armenians are an ancient people who speak an Indo-European language and have traditionally inhabited the border regions common to modern Armenia, Iran, and Turkey. They call themselves hai (from the name of Hayk, a legendary hero) and their country Haiastan. Their neighbors to the north, the Georgians, call them somekhi, but most of the rest of the world follows the usage of the ancient Greeks and refers to them as Armenians, a term derived according to legend from the Armen tribe. Thus the Russian word is armianin, and the Turkish is ermeni.
Armenia Economy
Economy – overview: Under the old Soviet central planning system, Armenia had developed a modern industrial sector, supplying machine tools, textiles, and other manufactured goods to sister republics in exchange for raw materials and energy. Since the implosion of the USSR in December 1991, Armenia has switched to small-scale agriculture away from the large agro-industrial complexes of the Soviet era. The agricultural sector has long-term needs for more investment and updated technology. The privatization of industry has been at a slower pace, but has been given renewed emphasis by the current administration. Armenia is a food importer, and its mineral deposits (gold, bauxite) are small. The ongoing conflict with Azerbaijan over the ethnic Armenian-dominated region of Nagorno-Karabakh and the breakup of the centrally directed economic system of the former Soviet Union contributed to a severe economic decline in the early 1990s. By 1994, however, the Armenian Government had launched an ambitious IMF-sponsored economic program that has resulted in positive growth rates in 1995-99. Armenia also managed to slash inflation and to privatize most small- and medium-sized enterprises. The chronic energy shortages Armenia suffered in recent years have been largely offset by the energy supplied by one of its nuclear power plants at Metsamor. Continued Russian financial difficulties have hurt the trade sector especially, but have been offset by international aid, domestic restructuring, and foreign direct investment.
GDP: purchasing power parity – $10 billion (2000 est.)
GDP – real growth rate: 5% (2000 est.)
GDP – per capita: purchasing power parity – $3,000 (2000 est.)
GDP – composition by sector:
agriculture: 40%
industry: 25%
services: 35% (1999 est.)
Population below poverty line: 45% (1999 est.)
Inflation rate (consumer prices): 1% (1999)
Labor force: 1.5 million (1999)
Labor force – by occupation: agriculture 55%, services 25%, manufacturing, mining, and construction 20% (1999 est.)
Unemployment rate: 20% (1998 est.)
note: official rate is 9.3% for 1998
Budget:
revenues: $360 million
expenditures: $566 million (1999 est.)
Industries: metal-cutting machine tools, forging-pressing machines, electric motors, tires, knitted wear, hosiery, shoes, silk fabric, washing machines, chemicals, trucks, watches, instruments, microelectronics
Industrial production growth rate: 5% (2000 est.)
Electricity – production: 6.668 billion kWh (1999)
Electricity – production by source:
fossil fuel: 45.56%
hydro: 23.25%
nuclear: 31.19%
other: 0% (1999)
Electricity – consumption: 6.201 billion kWh (1999)
Electricity – exports: 0 kWh (1999)
Electricity – imports: 0 kWh (1999)
Agriculture – products: fruit (especially grapes), vegetables; livestock
Exports: $284 million (f.o.b., 2000 est.)
Exports – commodities: diamonds, scrap metal, machinery and equipment, cognac, copper ore
Exports – partners: Belgium 36%, Iran 15%, Russia 14%, US 7%, Turkmenistan, Georgia (1999)
Imports: $913 million (f.o.b., 2000 est.)
Imports – commodities: natural gas, petroleum, tobacco products, foodstuffs, diamonds
Imports – partners: Russia 17%, US 11%, Belgium 11%, Iran 10%, UK, Turkey (1999)
Debt – external: $836 million (January 2001)
Economic aid – recipient: $245.5 million (1995)
Currency: 1 dram = 100 luma
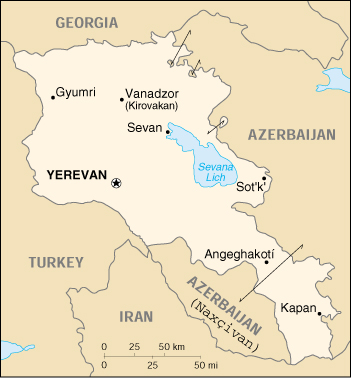
Map of Armenia