Facts About West Bank
Background: The Israel-PLO Declaration of Principles on Interim Self-Government Arrangements (the DOP), signed in Washington on 13 September 1993, provided for a transitional period not exceeding five years of Palestinian interim self-government in the Gaza Strip and the West Bank. Under the DOP, Israel agreed to transfer certain powers and responsibilities to the Palestinian Authority, which includes the Palestinian Legislative Council elected in January 1996, as part of interim self-governing arrangements in the West Bank and Gaza Strip. A transfer of powers and responsibilities for the Gaza Strip and Jericho took place pursuant to the Israel-PLO 4 May 1994 Cairo Agreement on the Gaza Strip and the Jericho Area and in additional areas of the West Bank pursuant to the Israel-PLO 28 September 1995 Interim Agreement, the Israel-PLO 15 January 1997 Protocol Concerning Redeployment in Hebron, the Israel-PLO 23 October 1998 Wye River Memorandum, and the 4 September 1999 Sharm el-Sheikh Agreement. The DOP provides that Israel will retain responsibility during the transitional period for external security and for internal security and public order of settlements and Israeli citizens. Permanent status is to be determined through direct negotiations, which resumed in September 1999 after a three-year hiatus. An intifadah broke out in September 2000; the resulting widespread violence in the West Bank and Gaza Strip, Israel’s military response, and instability in the Palestinian Authority are undermining progress toward a permanent settlement.
Currency: 1 new Israeli shekel (NIS) = 100 new agorot; 1 Jordanian dinar (JD) = 1,000 fils
Geography of the West Bank
Location: Middle East, west of Jordan
Geographic coordinates: 32 00 N, 35 15 E
Area:
total: 5,860 sq km
land: 5,640 sq km
water: 220 sq km
note: includes West Bank, Latrun Salient, and the northwest quarter of the Dead Sea, but excludes Mt. Scopus; East Jerusalem and Jerusalem No Man’s Land are also included only as a means of depicting the entire area occupied by Israel in 1967
Land boundaries:
total: 404 km
border countries: Israel 307 km, Jordan 97 km
Coastline: 0 km (landlocked)
Maritime claims: none (landlocked)
Climate: temperate, temperature and precipitation vary with altitude, warm to hot summers, cool to mild winters
Terrain: mostly rugged dissected upland, some vegetation in west, but barren in east
Elevation extremes:
lowest point: Dead Sea -408 m
highest point: Tall Asur 1,022 m
Natural resources: arable land
Land use:
arable land: 27%
permanent crops: 0%
permanent pastures: 32%
forests and woodland: 1%
other: 40%
Environment – current issues: adequacy of fresh water supply; sewage treatment
Geography – note: landlocked; highlands are main recharge area for Israel’s coastal aquifers; there are 231 Israeli settlements and civilian land use sites in the West Bank and 29 in East Jerusalem (August 1999 est.)
People of the West Bank
Population: 2,385,615 (July 2004 est.)
note: in addition, there are about 187,000 Israeli settlers in the West Bank and fewer than 177,000 in East Jerusalem.
Age structure:
0-14 years: 45%
15-64 years: 52%
65 years and over: 3%
Population growth rate: 3.38%
Birth rate: 36.73 births/1,000 population
Death rate: 4.49 deaths/1,000 population
Net migration rate: 1.51 migrant(s)/1,000 population
Infant mortality rate: 22.33 deaths/1,000 live births
Life expectancy at birth:
total population: 72.08 years
male: 70.39 years
female: 73.86 years
Total fertility rate: 5.02 children born/woman
Ethnic groups: Palestinian Arab and other 83%, Jewish 17%
Religions: Muslim 75% (predominantly Sunni), Jewish 17%, Christian and other 8%
Languages: Arabic, Hebrew (spoken by Israeli settlers and many Palestinians), English (widely understood)
West Bank Economy
Economy – overview: Economic output in the West Bank is governed by the Paris Economic Protocol of April 1994 between Israel and the Palestinian Authority. Real per capita GDP for the West Bank and Gaza Strip (WBGS) declined by 36.1% between 1992 and 1996 owing to the combined effect of falling aggregate incomes and rapid population growth. The downturn in economic activity was largely the result of Israeli closure policies – the imposition of border closures in response to security incidents in Israel – which disrupted established labor and commodity market relationships between Israel and the WBGS. The most serious social effect of this downturn was rising unemployment; unemployment in the WBGS during the 1980s was generally under 5%; by 1995 it had risen to over 20%. Since 1997 Israel’s use of comprehensive closures has decreased and, in 1998, Israel implemented new policies to reduce the impact of closures and other security procedures on the movement of Palestinian goods and labor. These changes fueled an almost three-year long economic recovery in the West Bank and Gaza Strip; real GDP grew by 5% in 1998 and 6% in 1999. Recovery was upended in the last quarter of 2000 with the outbreak of Palestinian violence, which triggered tight Israeli closures of Palestinian self-rule areas and a severe disruption of trade and labor movements.
GDP: purchasing power parity – $3.1 billion (2000 est.)
GDP – real growth rate: 4.6% (1999 est.), -7.5% (2000 est.)
GDP – per capita: purchasing power parity – $1,500 (2000 est.)
GDP – composition by sector:
agriculture: 33%
industry: 25%
services: 42% (includes Gaza Strip) (1995 est.)
Inflation rate (consumer prices): 5% (includes Gaza Strip) (1999 est.)
Labor force – by occupation: agriculture 13%, industry 13%, commerce, restaurants, and hotels 12%, construction 8%, other services 54% (1996)
Unemployment rate: 14.5% (includes Gaza Strip) (1998 est.)
Budget:
revenues: $1.6 billion
expenditures: $1.73 billion (includes Gaza Strip) (1999 est.)
Industries: generally small family businesses that produce cement, textiles, soap, olive-wood carvings, and mother-of-pearl souvenirs; the Israelis have established some small-scale, modern industries in the settlements and industrial centers
Electricity – production: most electricity imported from Israel; East Jerusalem Electric Company buys and distributes electricity to Palestinians in East Jerusalem and its concession in the West Bank; the Israel Electric Company directly supplies electricity to most Jewish residents and military facilities; at the same time, some Palestinian municipalities, such as Nabulus and Janin, generate their own electricity from small power plants.
Agriculture – products: olives, citrus, vegetables; beef, dairy products
Exports: $682 million (includes Gaza Strip) (f.o.b., 1998 est.)
Exports – commodities: olives, fruit, vegetables, limestone
Exports – partners: Israel, Jordan, Gaza Strip
Imports: $2.5 billion (includes Gaza Strip) (c.i.f., 1998 est.)
Imports – commodities: food, consumer goods, construction materials
Imports – partners: Israel, Jordan, Gaza Strip
Debt – external: $108 million (includes Gaza Strip) (1997 est.)
Economic aid – recipient: $800 million pledged (includes Gaza Strip) (1999)
Currency: 1 new Israeli shekel (NIS) = 100 new agorot; 1 Jordanian dinar (JD) = 1,000 fils
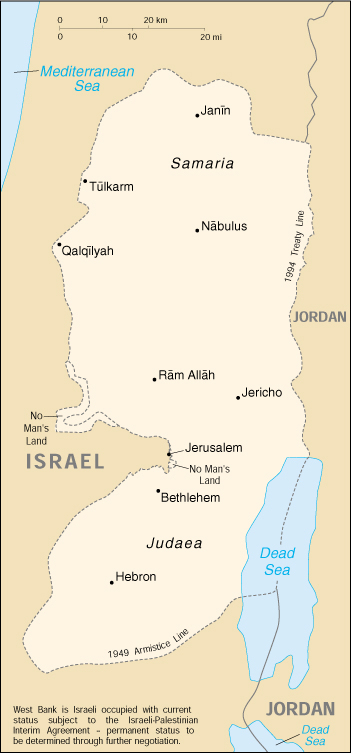
Map of the West Bank